|
|
Post by instaforexbella on Apr 15, 2024 7:12:01 GMT -5
Forex Analysis & Reviews: EUR/USD and GBP/USD: Technical analysis on April 15
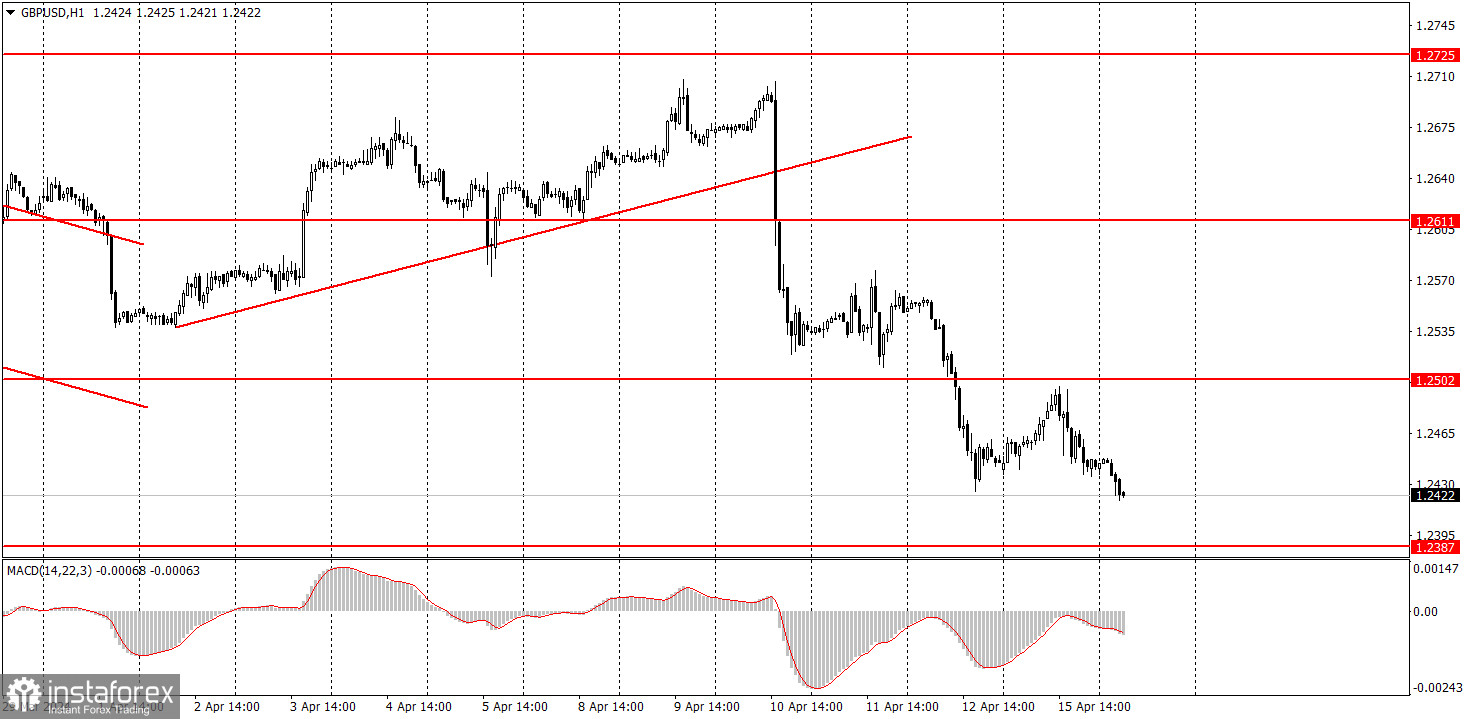
EUR/USD 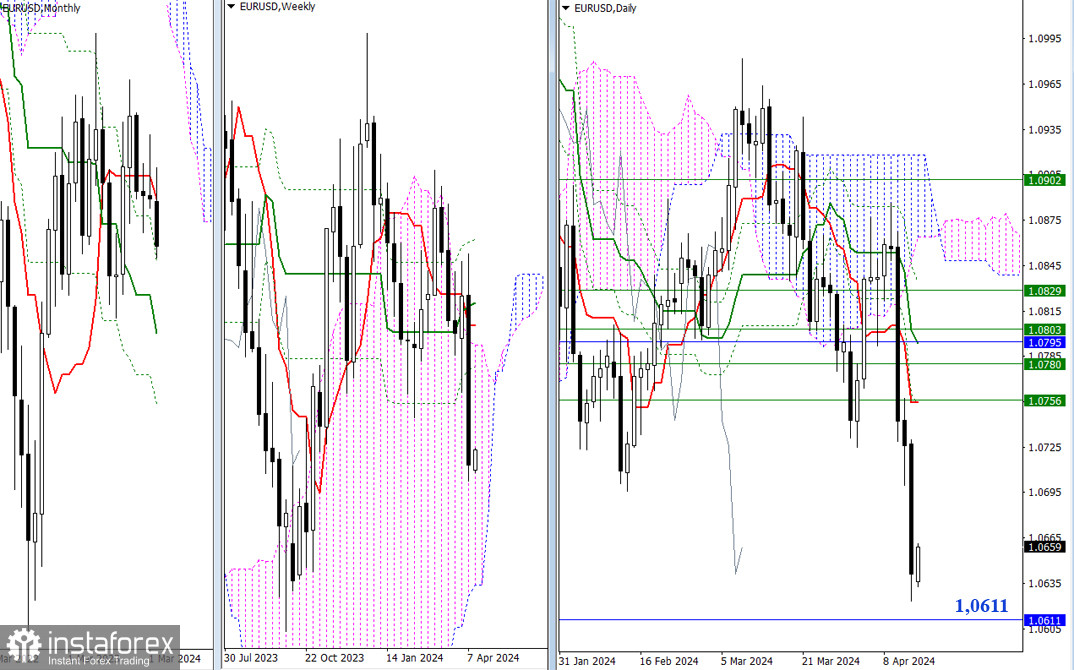 Higher Timeframes Last week had a pronounced bearish character due to the significant downward momentum. Bears approached the influence zone of the monthly support at 1.0611, so the results of testing and interaction may determine further priorities and opportunities. The levels passed today act as supports, but due to the remote location (1.0755), they are unlikely to be relevant in the near future. H4 - H1 The main advantage on the lower timeframes currently belongs to the bearish players. However, the pair is trading within an upward correction zone, now testing the central pivot point (1.0665). The next resistance in the development of the correction today can be noted at 1.0706 (R1), but the meeting with the weekly long-term trend (1.0771), which governs the current balance of power, will be of greater significance. A breakout and reversal of the trend could change the market's preferences. If the current correction is completed and the pair returns to the downward trend's development, the bears' focus will be on passing through the supports of classic pivot points (1.0599 - 1.0558 - 1.0492). GBP/USD 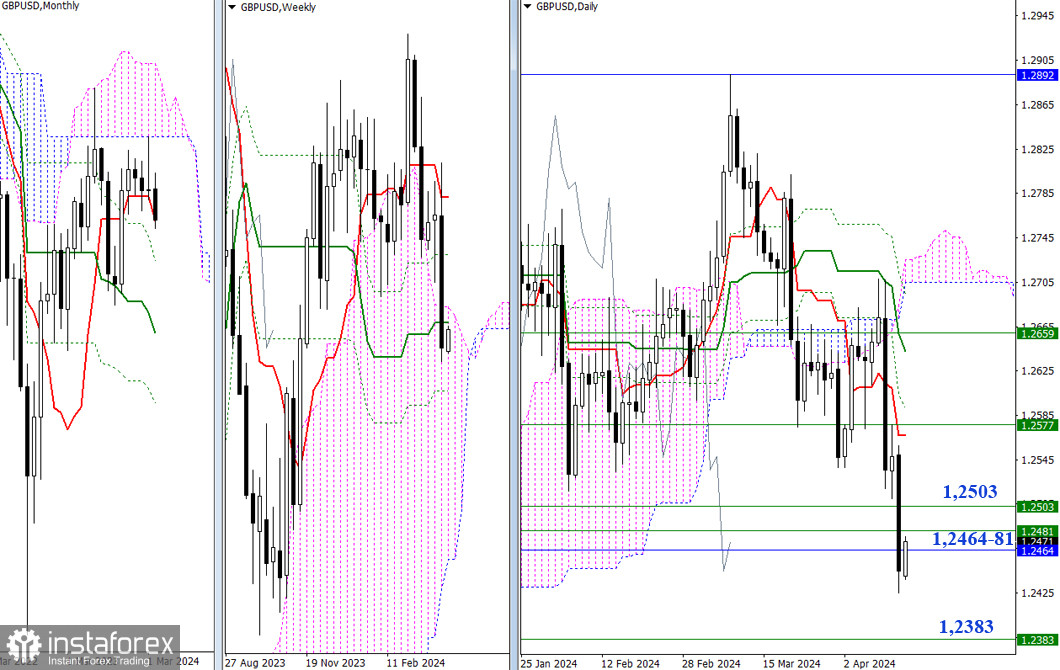 Higher Timeframes Last week, bearish players managed to assert themselves by closing the week below the current supports (1.2464 - 1.2481 - 1.2503). The main task now is to maintain the achieved level. The next bearish target on the higher timeframes is the final level of the golden cross of the weekly Ichimoku cloud (1.2383). For bullish players to re-enter the market under current conditions, they need to form a rebound from the encountered support zone (1.2464 - 1.2481 - 1.2503) Analysis are provided by InstaForex. Read more: ifxpr.com/3xCnAfO
|
|
|
|
Post by instaforexbella on Apr 16, 2024 1:48:49 GMT -5
Forex Analysis & Reviews: Trading plan for GBP/USD on April 16. Simple tips for beginners
 The GBP/USD pair also tried to start a minor bullish correction on Monday, but the downward movement resumed in the second half of the day. Take note that a significant event occurred last week – the pair left the 4-month sideways channel and may now begin forming a strong downtrend. There were concerns that the new week would start with another illogical rise from the pound, but so far they have not been justified. The British pound should fall along with the euro, as there are many more reasons for the US dollar to rise. The key reason for the pair's decline is the Federal Reserve's hawkish policy, while the market has been expecting monetary easing from the US central bank. These hopes have not been justified, as inflation in the United States is rising. At the same time, inflation in the United Kingdom could reach 3% this week, which would give the Bank of England the opportunity to begin discussing the timing of the first policy easing. The movements and trading signals on the 5-minute timeframe were not the best. During the European trading session, a buy signal was formed around the level of 1.2457, but the price failed to reach the target level of 1.2502 by just a few pips. Subsequently, there was a rebound from the level of 1.2457, but the price failed to reach the target level once again. Therefore, the first two signals could be considered false signals, and the third signal around the level of 1.2457 should not have been executed. Profit from both trades could only be obtained if the trades were manually closed. Trading tips on Tuesday: On the hourly chart, the GBP/USD pair finally has real technical grounds to end the 4-month flat phase. After surpassing the level of 1.2502, traders may expect a new downward trend. The fundamental and macroeconomic backdrop continues to support the dollar to a much greater extent than the British one. Therefore, we only expect downward movements from the pair. On Tuesday, novice traders can look for sell signals below the level of 1.2502. A correction may follow, but it is unlikely to be a strong movement. If the price does not return above the level of 1.2502 in the near future, the chances of forming a downward trend will increase even more. The key levels on the 5M chart are 1.2270, 1.2310, 1.2372-1.2387, 1.2457, 1.2502, 1.2544, 1.2605-1.2611, 1.2648, 1.2691, 1.2725, 1.2787-1.2791. Today, the UK will release reports on unemployment, unemployment claims, and average earnings. These data may affect the pair's movement, but the downtrend is expected to persist. The US will only publish minor reports. Analysis are provided by InstaForex. Read more: ifxpr.com/3xCzKW9
|
|
|
|
Post by instaforexbella on Apr 17, 2024 2:35:07 GMT -5
Forex Analysis & Reviews: Overview for the GBP/USD pair on April 17th. British inflation could weigh on the pound The GBP/USD currency pair also attempted to start an upward correction on Tuesday, but volatility throughout the day was again very low. As seen in the illustration below, what we mean by "low volatility" is clear. Out of the last 30 days, there were only nine days when volatility exceeded 90 points. Another nine days ended with volatility below 50 points, indicating a complete lack of movement. Thus, the British pound has been moving very weakly in recent months. Last week, the pair exited the sideways channel in which it had spent four months, which was an additional "joy" for traders. The market finally considered the entire fundamental and macroeconomic background, which has long been signaling the inevitable rise of the American currency. As with the euro, we want readers to understand us correctly. We do not believe that the dollar should always rise. Or that the dollar will rise for another year. But the current fundamental background, which indicates that the Fed will begin a cycle of easing at an unknown time, and the Bank of England - within the foreseeable future, supports only the dollar, as the Fed's monetary policy will remain "hawkish" even longer than the Bank of England's policy. Recall that the market was expecting the exact opposite at the beginning of the year. Everyone expected rate cuts from the Fed in March. Then, it became clear that March was a miss, and traders switched to June. According to the FedWatch tool, the probability of a rate cut in June is 24%. This is when, before the US inflation report for March, the probability exceeded 65%, sometimes even reaching 80%. We have repeatedly said that the market is wrong in its expectations regarding the Fed and Bank of England rates. And based on this erroneous opinion, it conducts illogical trading, which only causes bewilderment. However, the market is starting to come back to earth, so movements become more logical. And if so, you can expect only a decline in the British pound and a rise in the dollar. Today, the inflation report for March will be published in the UK. According to experts' forecasts, the consumer price index will decrease to 3.1% y/y and core inflation to 4.1%. Thus, core inflation will officially be lower than in the US, whose Fed was supposed to cut rates as early as March. Which of the two central banks is then closer to easing monetary policy? If we had assumed earlier that both central banks could start cutting rates simultaneously, now we believe that the Bank of England would be the first, whose rate is already lower. Thus, the overall conclusion can only be one: the pair should continue moving to the south. From a technical point of view, on the 24-hour TF, the pair has been correcting upwards for about half a year, and now it may resume the downward trend that started last summer. If so, the targets for the decline of the British currency are around the 20th level and below. Analysis are provided by InstaForex. Read more: ifxpr.com/4ddYZ1l
|
|
|
|
Post by instaforexbella on Apr 18, 2024 1:53:09 GMT -5
Forex Analysis & Reviews: Trading plan for GBP/USD on April 18. Simple tips for beginners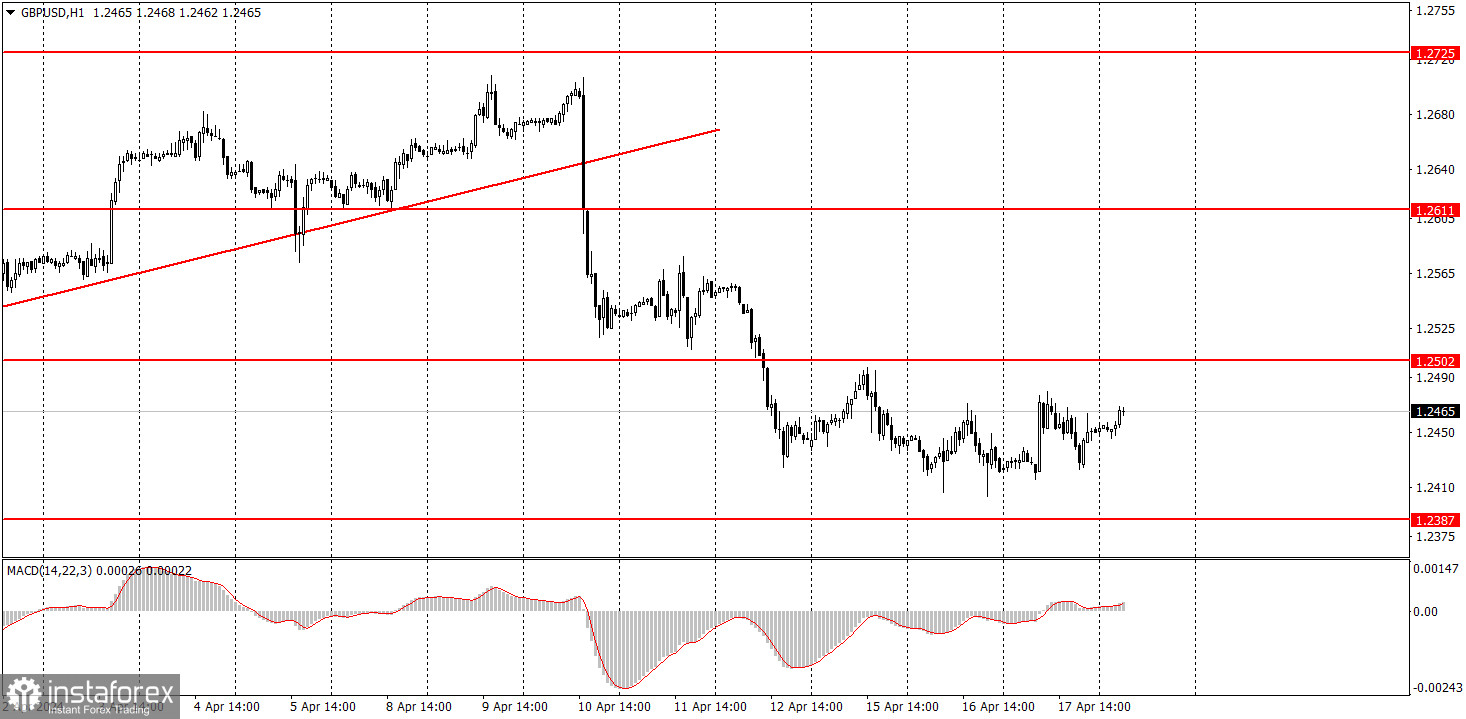 The GBP/USD pair continued to trade sideways on Wednesday. After the price broke out of the 1.25-1.28 sideways channel, the pair suddenly stopped falling. Unfortunately, in this case, the pair may correct higher. We still expect a new downward trend since the pound doesn't have any solid reasons to rise. However, it appears that the market is returning to its previous stance where the pound is untouchable, no matter what happens. The British currency continues to trade in an aloof manner, despite last week's decline. Yesterday, the Consumer Price Index in the UK showed that inflation decreased to 3.2% in March. In our opinion, this is enough for the pound to continue its downward movement, as it should fall further even without this report. However, the market was disappointed by the fact that inflation did not sharply fall, although the Bank of England is now closer to the first monetary policy easing than the Federal Reserve. So for now, the aloofness persists. 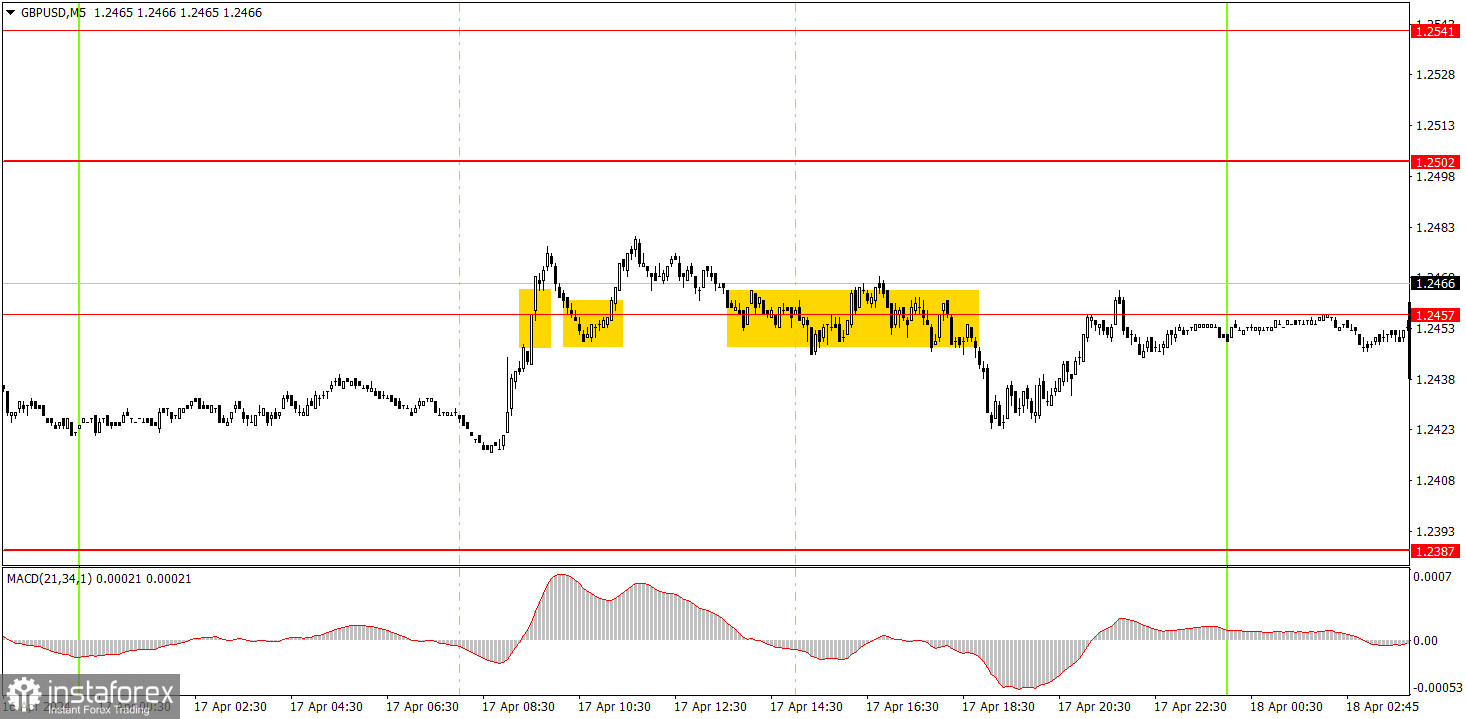 Several trading signals were formed on the 5-minute timeframe, but due to the flat movement over the past few days, all the signals turned out to be false. Initially, the pair breached the level of 1.2457 from below, then rebounded from it from above (a duplicate signal), and finally settled below it. Beginners could open both long and short positions yesterday, but at best, they faced breakeven outcomes. Traders could only potentially earn 10-15 pips with the second trade by manually closing it closer to the evening. Analysis are provided by InstaForex. Read more: ifxpr.com/4aDW93Q
|
|
|
|
Post by instaforexbella on Apr 19, 2024 2:43:54 GMT -5
Forex Analysis & Reviews: Overview of the GBP/USD pair on April 19th. The Bank of England may lower the rate in May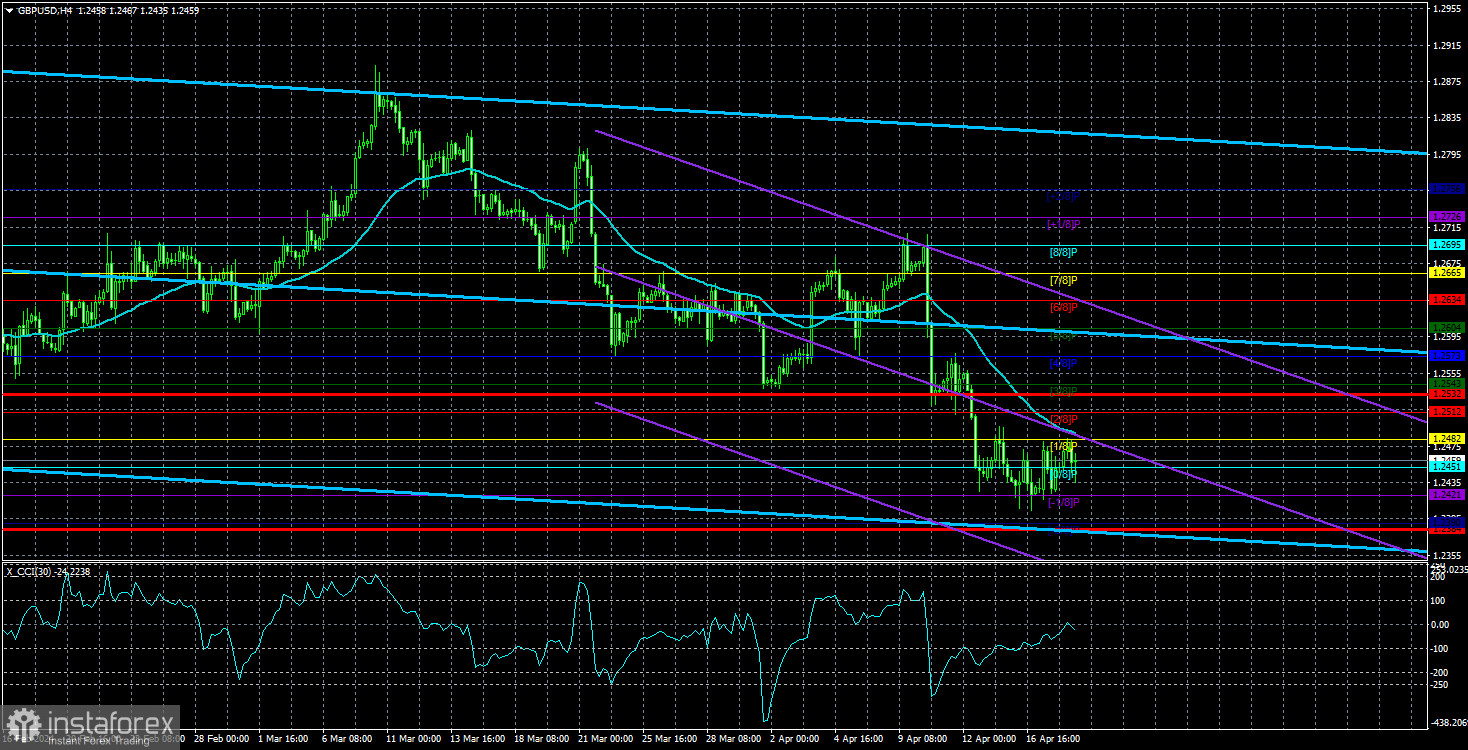 The GBP/USD currency pair remained stagnant on Thursday. In the EUR/USD article, we used the phrase that the British currency "remains flat even after exiting the flat." Let's explain what it means. The British pound traded in a sideways channel of 1.25-1.28 (approximate boundaries) for 4 months. Last week saw the long-awaited breakthrough below the lower boundary; after that, nothing happened. The super-overbought pound still has yet to decline despite the UK economy being in a recession, and the Bank of England might start easing monetary policy much sooner than the market expects. The pound is reluctant to depreciate, despite the excellent condition of the US economy, labor market, and business activity. The market refuses to buy the dollar, despite the Fed's hawkish policy stance and the absence of inflation slowdown overseas. Thus, the GBP/USD pair is currently trading illogically. In essence, we are still determining the completion of the flat on the 24-hour timeframe. Yes, the pair has exited the sideways channel, but on the 4-hour timeframe, it has been stationary for a week now. Some may argue that this week's macroeconomic backdrop is weak, hence the pair's almost immobilized state. We consider such an opinion erroneous, as at least two events in the past few days should have moved the price off dead center. Inflation in the UK is approaching levels where it would be appropriate for the central bank to start discussing monetary policy easing. Jerome Powell made it clear that any rate cuts in the near future are out of the question. Analysis are provided by InstaForex. Read more: ifxpr.com/3U7r9C8
|
|
|
|
Post by instaforexbella on Apr 22, 2024 6:54:20 GMT -5
Forex Analysis & Reviews: USD/JPY: trading tips for beginners for European session on April 22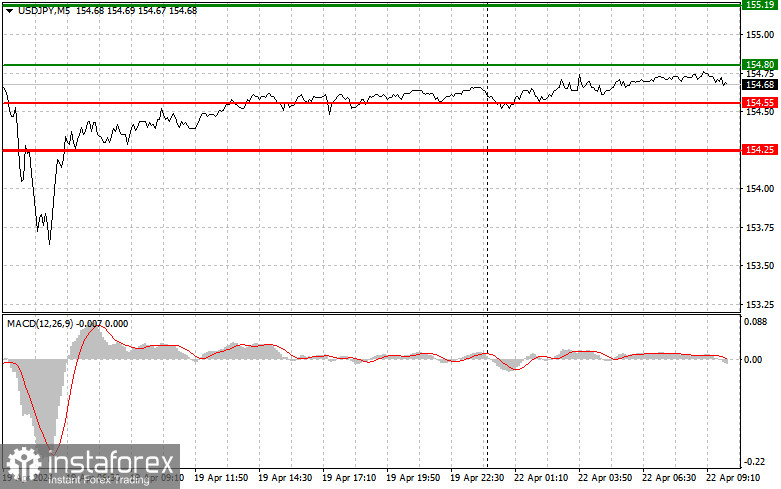 Overview of trading and tips on USD/JPY The tests of the levels I identified in the afternoon did not materialize. The pair managed to recover its losses, and it stayed near the daily high during the US session. It is unlikely that amid the lack of important US data, buyers will somehow take the initiative at the current levels. Today, hardly anything significant will happen in the market unless the Bank of Japan intervenes. The absence of data paralyzed market activity, which keeps the pair in a narrow range with low trading volume and low volatility. As for the intraday strategy, I will rely more on the implementation of scenarios No. 1 and No. 2. Buy signals Scenario No. 1. I plan to buy USD/JPY today when the price reaches the entry point around 154.79 plotted by the green line on the chart, aiming for growth to 155.29 plotted by the thicker green line on the chart. In the area of 155.29, I'm going to exit long positions and open short ones in the opposite direction, expecting a movement of 30-35 pips in the opposite direction from that level. You can count on USD/JPY's growth today based on the trend after breaking through the daily high. Before buying, make sure that the MACD indicator is above the zero mark and is just starting to rise from it. Scenario No. 2. I also plan to buy USD/JPY today in case of two consecutive tests of 154.32 at the time when the MACD indicator is in the oversold area. This will limit the downward potential of the pair and lead to an upward reversal of the market. We can expect growth to the opposite levels of 154.79 and 155.29. Sell signals Scenario No. 1. I plan to sell USD/JPY today only after testing the level of 154.32 plotted by the red line on the chart, which will lead to a rapid decline in the price. The key target for sellers will be 153.93, where I am going to exit short positions and also immediately open long ones in the opposite direction, expecting a movement of 20-25 pips in the opposite direction from that level. Pressure on USD/JPY may return after an unsuccessful breakout of the daily high and active actions by the central bank. Before selling, make sure that the MACD indicator is below the zero mark and is just starting to decline from it. Scenario No. 2. I also plan to sell USD/JPY today in case of two consecutive tests of the price of 154.79 at the time when the MACD indicator is in the overbought area. This will limit the pair's upward potential and lead to a downwards market reversal. We can expect a decline to the opposite levels of 154.32 and 153.93. Analysis are provided by InstaForex. Read more: ifxpr.com/3w2GxYw
|
|
|
|
Post by instaforexbella on Apr 23, 2024 7:39:41 GMT -5
Forex Analysis & Reviews: GBP/USD: trading plan for the US session on April 23rd (analysis of morning deals). The pound continues to decline 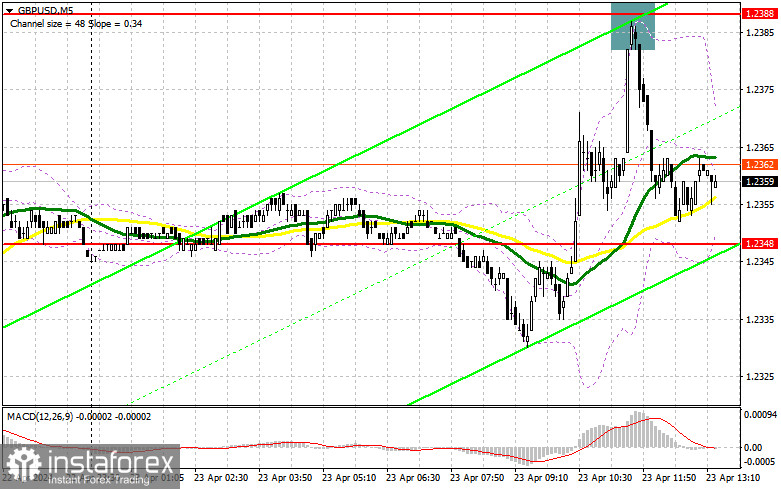 In my morning forecast, I paid attention to the 1.2388 level and planned to make decisions on entering the market from it. Let's look at the 5-minute chart and figure out what happened there. The growth and formation of a false breakdown in the area of 1.2388 led to a sell signal for the pound, which resulted in a drop in the pair by more than 30 points. In the afternoon, the technical picture was revised. 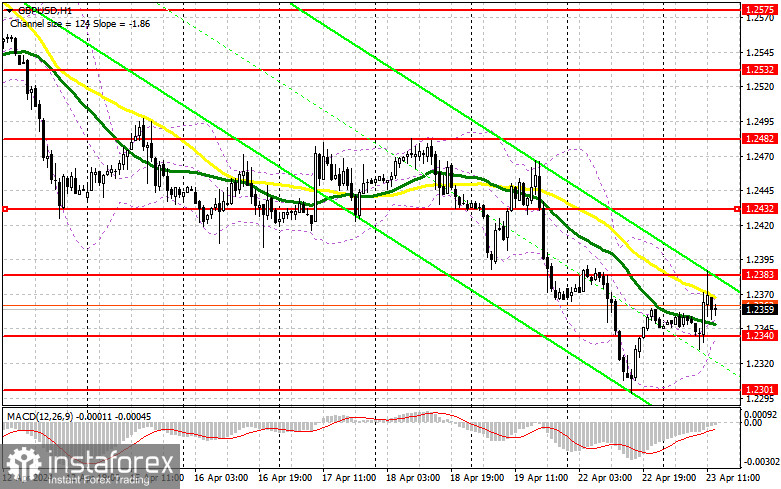 To open long positions on GBP/USD, it is required: The strong data on activity in the UK services sector and the weak report on the reduction in manufacturing activity were received positively, since the British economy is still based more on services. This provoked purchases of the pound, but the euphoria did not last long. The growth was perceived by sellers as an excellent entry point into short positions. In the afternoon, there is a lot of data related to activity in the American economy, so there should be movement. The index of business activity in the manufacturing sector, the index of business activity in the service sector and the composite PMI index will be the warm-up, after which figures on home sales in the primary market and the Fed-Richmond manufacturing index will be released. Strong data will lead to a larger sell-off of the pound on trend, so be careful with purchases. In the case of a decline in the pair, much will depend on the behavior of traders at the level of 1.2340, where only the formation of a false breakdown will give an entry point to buy in order to grow to the resistance of 1.2383 formed at the end of the first half of the day. A breakout and a top-down test of this range will return the chance of a GBP/USD recovery, which will lead to new purchases and allow you to get to 1.2432. In the case of an exit above this range, we can talk about a breakthrough to 1.2482, where I'm going to fix profits. In the scenario of a fall in GBP/USD and the absence of buyers at 1.2340 in the afternoon, sellers will regain control of the market, having the opportunity to continue a major drop in the pair further along the trend. In this case, I will look for purchases in the area of 1.2301. The formation of a false breakdown there will be a suitable option for entering the market. It is possible to open long positions on GBP/USD immediately on a rebound from 1.2265 in order to correct 30-35 points within a day. To open short positions on GBP/USD, you need: The bears have every chance to continue the pair's decline. To do this, you need to protect the new resistance of 1.2383, where the moving averages are located slightly lower, playing on their side. The formation of a false breakdown there will make sure that large sellers are present in the market, which, together with strong data, will lead to a further fall in GBP/USD and an excellent entry point into short positions in order to test the nearest resistance of 1.2340. A breakout and a reverse test from the bottom up of this range will increase the pressure on the pair, giving the bears an advantage and another entry point to sell with the aim of updating 1.2301. The ultimate target will be a minimum of 1.2265, where I will take a profit. In the event of GBP/USD's rise and absence of bears at 1.2383 in the second half of the day, bulls will have the opportunity to build a good correction with upward movement towards the resistance at 1.2432. I will also sell there only on a false breakout. If there is no activity there either, I suggest opening short positions on GBP/USD from 1.2482, counting on a pair's rebound downwards by 30-35 points within the day. Analysis are provided by InstaForex. Read more: ifxpr.com/3QCXjEX |
|
|
|
Post by instaforexbella on Apr 24, 2024 7:35:23 GMT -5
Forex Analysis & Reviews: USD/JPY: Simple trading tips for novice traders on April 24th (US session)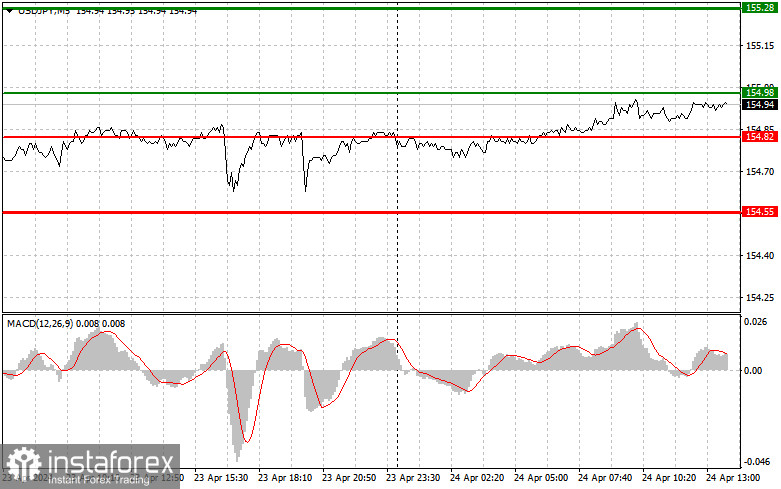 Trade analysis and advice on trading the Japanese yen In line with our usual trading approach, there were no tests of the levels I indicated in the first half of the day near the annual maximum, which prevented entry into the market. Traders betting on the rise of the dollar are increasingly adhering to a strategy of buying on declines from good and solid levels, as only some believe in breaking the annual maximum and significant growth after that. I advise you to do the same, especially since there are no forthcoming statistics capable of leading to breakthroughs in maximums. Data on changes in US durable goods orders is expected, and that's about it. So, trading within the channel and buying on downward slips will be the most relevant option. As for the intraday strategy, I will rely more on scenario #2. 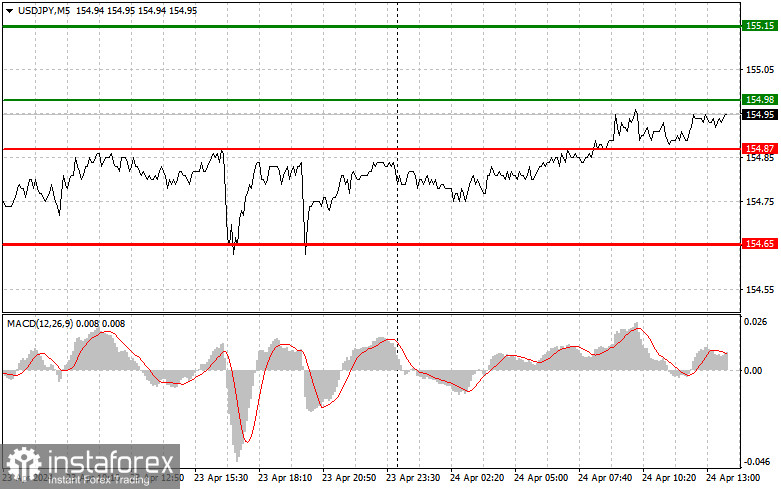 Buy Signal Scenario #1: Today, I plan to buy USD/JPY when the entry point reaches around 154.98 (green line on the chart), with the target of rising to the level of 155.15 (thicker green line on the chart). At around 155.15, I will exit purchases and open sales in the opposite direction (aiming for a movement of 30-35 pips in the opposite direction from the level). Counting on the pair's rise today will only work after very strong US statistics. Important! Before buying, make sure that the MACD indicator is above the zero mark and is just starting to rise from it. Scenario #2: I also plan to buy USD/JPY today in case of two consecutive tests of the price at 154.87 when the MACD indicator is in the oversold zone. This will limit the downward potential of the pair and lead to a reversal of the market upwards. Expect a rise to the opposite levels of 154.98 and 155.15. Sell Signal Scenario #1: I plan to sell USD/JPY today after updating the level of 154.87 (red line on the chart), which will lead to a rapid decline in the pair. The key target for sellers will be the level of 154.65, where I will exit sales and also immediately open purchases in the opposite direction (aiming for a movement of 20-25 points in the opposite direction from the level). Pressure on the pair will return in case of an unsuccessful breakout of the daily maximum. Important! Before selling, make sure that the MACD indicator is below the zero mark and is just starting to decrease from it. Scenario #2: I also plan to sell USD/JPY today in case of two consecutive tests of the price at 154.98 when the MACD indicator is in the overbought zone. This will limit the upward potential of the pair and lead to a reversal of the market downwards. Expect a decline to the opposite levels of 154.87 and 154.65. Analysis are provided by InstaForex. Read more: ifxpr.com/49Stirt
|
|
|
|
Post by instaforexbella on Apr 25, 2024 6:13:13 GMT -5
Forex Analysis & Reviews: EUR/USD. April 25th. Bulls continue to advance and expect a weak US GDP report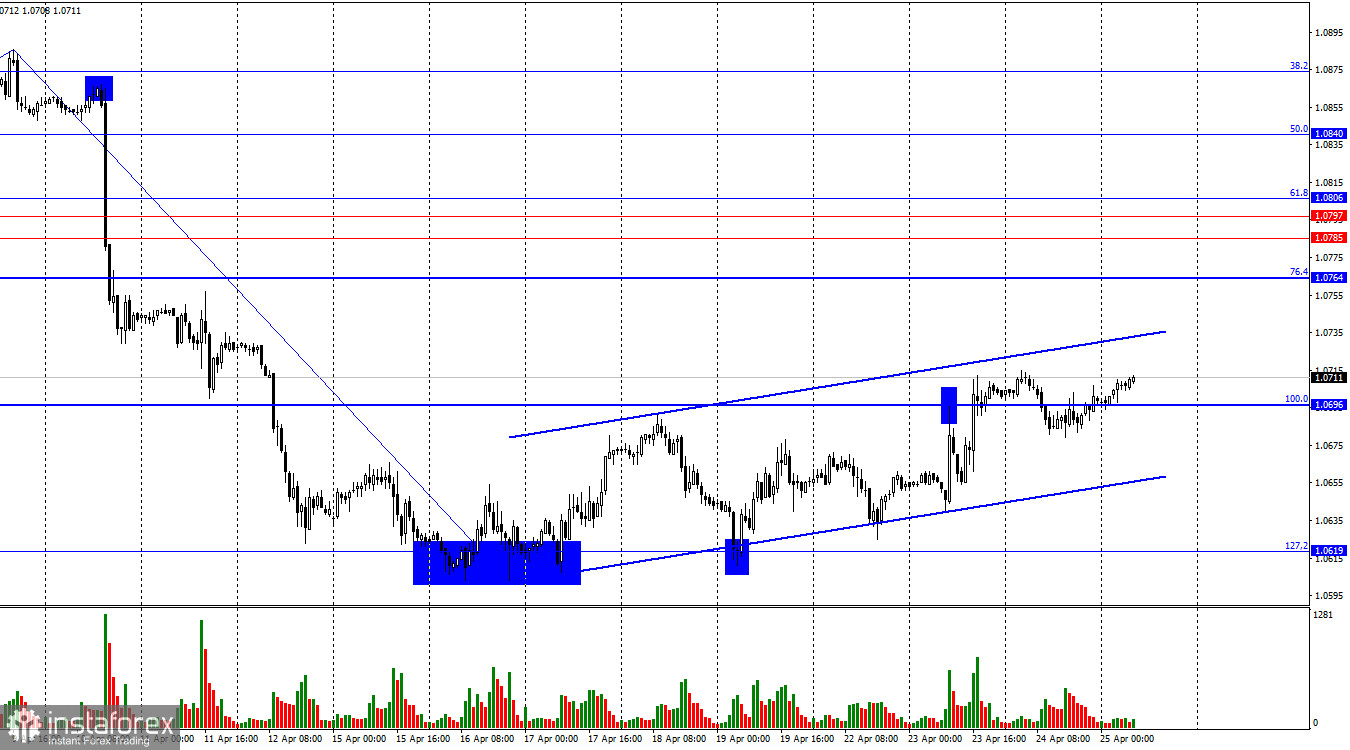 The EUR/USD pair made a new turnaround in favor of the European currency on Wednesday, consolidating above the corrective level of 100.0%-1.0696. Thus, the growth process may continue today towards the next Fibonacci level at 76.4% (1.0764). The ascending trend channel characterizes the current sentiment of traders as bullish, but I remind you that the bearish trend persists. Consolidation of the pair's rate below the corridor will favor the US currency and resume the decline of the euro. The wave situation remains unchanged. The last completed downward wave broke the low of the previous wave (from April 2), while the new upward wave is still too weak to break the last peak from April 9. Thus, we are dealing with a bearish trend, and at the moment, there is no sign of its completion. For such a sign to appear, the new upward wave needs to break the peak of the previous wave (from April 9). Alternatively, the next downward wave should fail to break the last low from April 16. Until then, the bears will maintain the advantage. The information background on Wednesday needed to be more formal for traders. The report on durable goods orders in the US showed an increase of 2.6% in March against market expectations of +2.5%. Orders excluding transportation increased by 0.2% against forecasts of +0.3%. Orders excluding defense increased by 0.2% against market expectations of +0.2%. Thus, all three reports, which could prompt traders to trade more actively, had little impact on their sentiment. Today, we await the US GDP report for the first quarter, which may suffer the same fate as yesterday's publications. 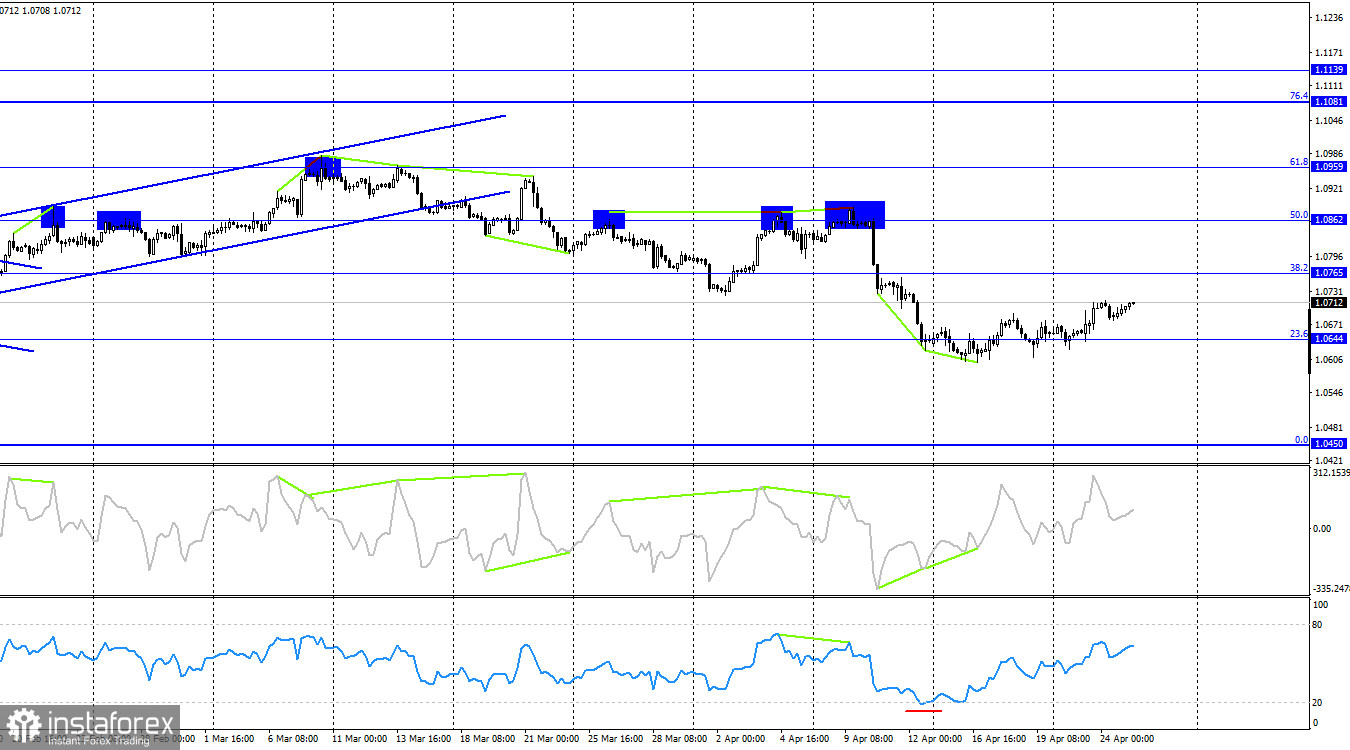 In the last reporting week, speculators opened 3493 long contracts and 23992 short contracts. The sentiment of the "non-commercial" group remains bullish but continues to weaken rapidly. The total number of long contracts held by speculators now stands at 179,000, while short contracts amount to 167,000. The situation will continue to change in favor of bears. In the second column, we see that the number of short positions increased from 92,000 to 167,000 over the last 3 months. Over the same period, the number of long positions decreased from 211,000 to 179,000. Bulls have dominated the market for too long, and now they need strong information to resume the bullish trend. However, the information background has only been supporting bears lately. The European currency could have lost much more ground in recent weeks. Analysis are provided by InstaForex. Read more: ifxpr.com/49QZifp
|
|
|
|
Post by instaforexbella on Apr 26, 2024 7:37:57 GMT -5
Forex Analysis & Reviews: EUR/USD. April 26th. Bulls continue to advance after the GDP report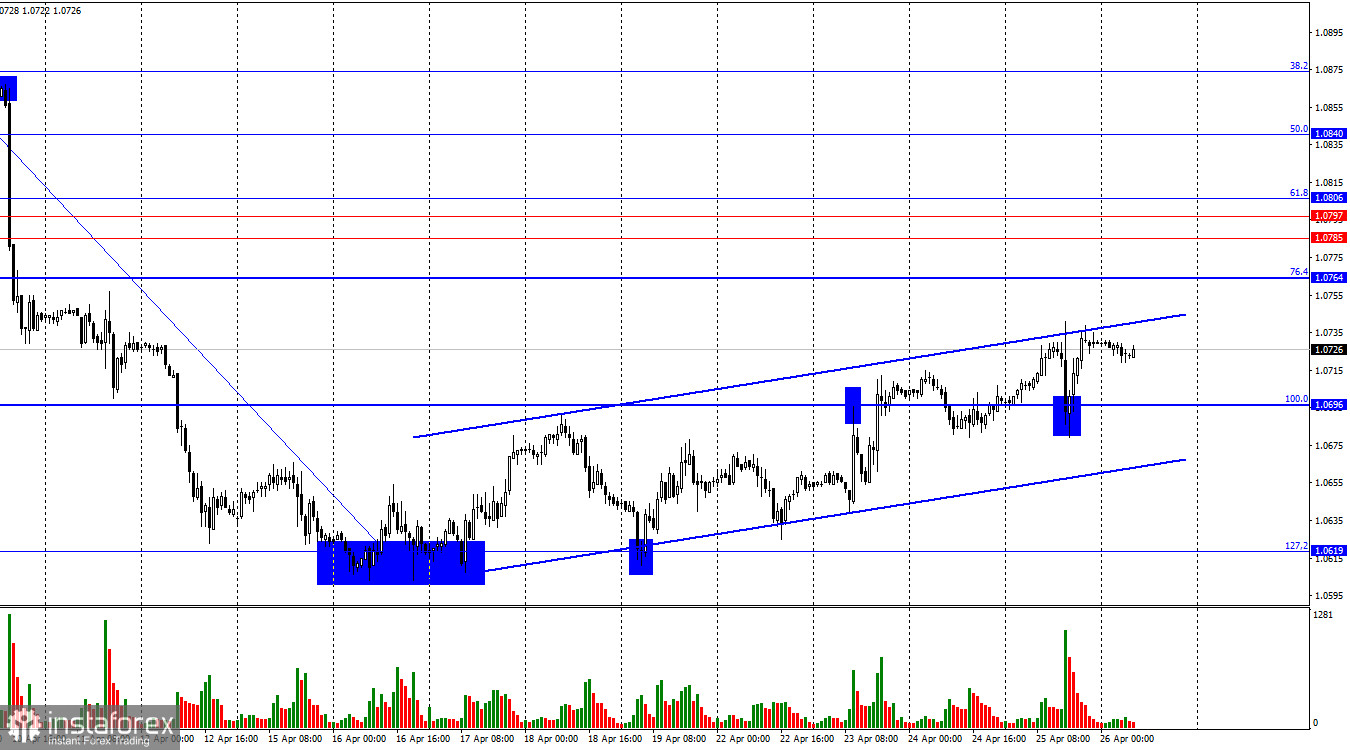 The EUR/USD pair on Thursday rebounded from the corrective level of 100.0%-1.0696 and resumed its upward movement towards the corrective level of 76.4%-1.0764. The ascending trend channel continues to characterize the current market sentiment as "bullish." Consolidation of quotes below the ascending corridor will change the market sentiment to "bearish" and may lead to a resumption of the pair's decline towards the level of 1.0619 and below. The wave situation remains unchanged. The last completed downward wave broke the low of the previous wave (from April 2nd), and the new upward wave is still too weak to break the last peak from April 9th. Thus, we are dealing with a "bearish" trend, and at the moment, there is no sign of its completion. For such a sign to appear, the new upward wave needs to break the peak of the previous wave (from April 9th). If the next downward wave fails to break the last low from April 16th, this will also be a sign of a trend change to "bullish." Until then, the bears will maintain their advantage. The information background on Thursday was important and strong. Traders learned about the economic growth of the United States in the first quarter. It amounted to 1.6% quarter-on-quarter and 3.1% year-on-year. It is noteworthy that the quarterly GDP of the United States turned out to be significantly below traders' expectations, while the annual one was higher. Bears failed to benefit from this report, as the quarterly value is still slightly more important. The American economy continues to slow down for the second quarter in a row, and the pace of the slowdown is quite high. At this rate, by the end of the year, the US economy may show growth close to zero, as is currently happening in the UK and the EU. A reduction in the Federal Reserve rate will not happen anytime soon, so the US economy may continue to slow down. 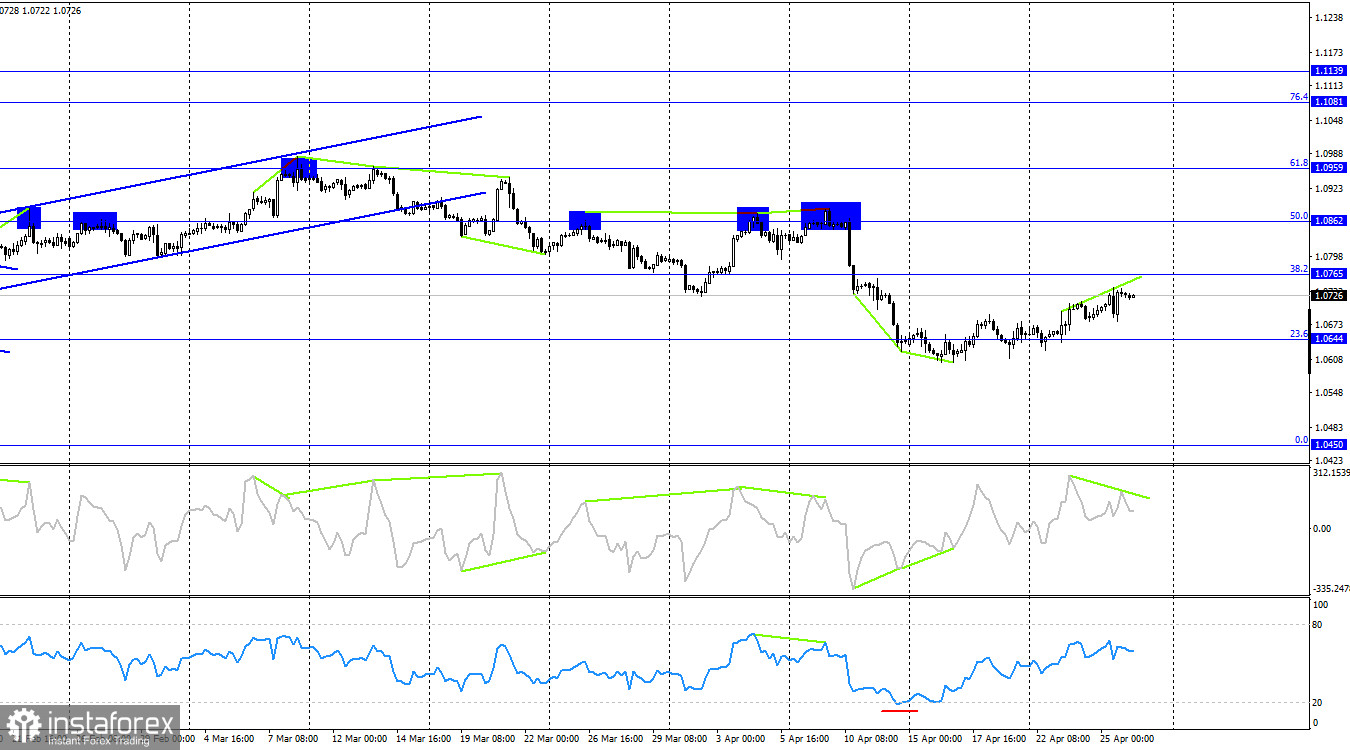 In the last reporting week, speculators opened 3493 long contracts and 23992 short contracts. The sentiment of the "Non-commercial" group remains "bullish" but continues to weaken rapidly. The total number of Long contracts held by speculators now stands at 179 thousand, while Short contracts amount to 167 thousand. The situation will continue to change in favor of bears. In the second column, we see that the number of Short positions has increased from 92 thousand to 167 thousand over the past 3 months. During the same period, the number of Long positions decreased from 211 thousand to 179 thousand. Analysis are provided by InstaForex. Read more: ifxpr.com/4dcIhzc
|
|
|
|
Post by instaforexbella on Apr 29, 2024 7:44:06 GMT -5
Forex Analysis & Reviews: GBP/USD: trading plan for the US session on April 29th (analysis of morning deals). The pound continues to be bought at every opportunity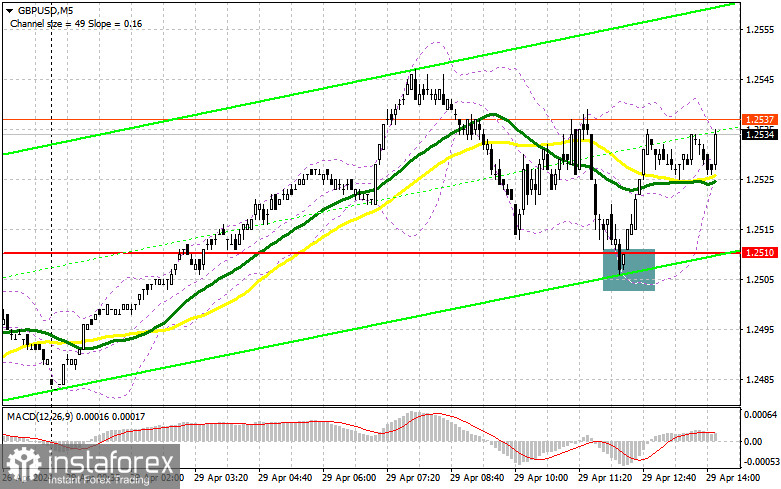 In my morning forecast, I paid attention to the 1.2510 level and planned to make decisions on entering the market from it. Let's look at the 5-minute chart and figure out what happened there. The decline and the formation of a false breakdown there after an unsuccessful attempt to gain a foothold below 1.2510 allowed us to get a buy signal, which resulted in a 30-point increase in the pair. In the afternoon, the technical picture was not revised. 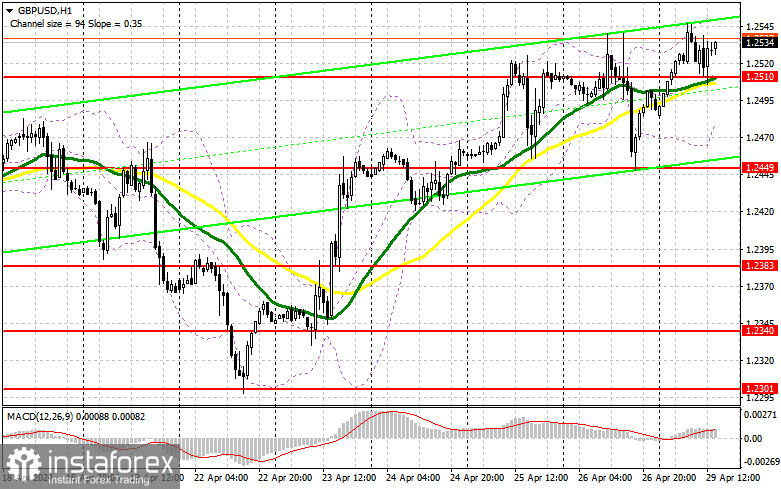 To open long positions on GBP/USD, you need: The lack of statistics for the UK helped the buyers of the pound to beat off 1.2510 and now let's see if they will be able to achieve an update to the weekly maximum or not. The reason for the low volatility in the afternoon will be the complete absence of any data on the United States and the impending meeting of the Federal Reserve System, which will be able to change the current "rules of the game". For this reason, it is not necessary to force events: the formation of a false breakdown in the support area of 1.2510, by analogy with the first half of the day, will give an entry point to buy in order to grow to the resistance of 1.2573. The moving averages also pass around 1.2510, so you can again count on the active actions of the bulls. A breakout and a top-down test of 1.2573 will give a chance for GBP/USD growth, which will allow you to reach 1.2621. In the case of an exit above this range, we can talk about a breakthrough to 1.2658, where I'm going to fix profits. A test of this level is unlikely today, but anything is possible in the market. In the scenario of a fall in GBP/USD and the absence of buyers at 1.2510 in the afternoon, the market will maintain balance, and trading will move within the framework of the side channel. In this case, I will look for purchases in the area of 1.2449. The formation of a false breakdown there will be a suitable option for entering the market. It is possible to open long positions on GBP/USD immediately on a rebound from 1.2383 in order to correct 30-35 points within a day. To open short positions on GBP/USD, you need: The bears still have a chance to continue to return to the pair's decline, but for this they need to take 1.2510, which they failed to do in the first half of the day. In case of further growth of the pair, I will postpone sales until the test of the new resistance of 1.2573, which buyers have been looking at with great interest for a long time. Only the formation of a false breakdown there will make sure that large sellers are present in the market, which will lead to a fall in GBP/USD to the area of 1.2510, where the moving averages are located. A breakout and a reverse test from the bottom up of this range will increase the pressure on the pair, giving the bears an advantage and another entry point to sell with the aim of updating 1.2449. The ultimate target will be the minimum of 1.2383, where I will take a profit. In the scenario of GBP/USD rising and the absence of bears at 1.2573 in the second half of the day, bulls will have the opportunity to continue building an upward trend with movement towards the resistance at 1.2621. I will only enter there on a false breakout. If there is no activity there either, I suggest opening short positions on GBP/USD from 1.2658, expecting a pair to rebound down by 30-35 points within the day. Analysis are provided by InstaForex. Read more: ifxpr.com/4bgdWxI
|
|
|
|
Post by instaforexbella on May 2, 2024 5:44:33 GMT -5
Forex Analysis & Reviews: USD/JPY: trading tips for beginners for European session on May 2 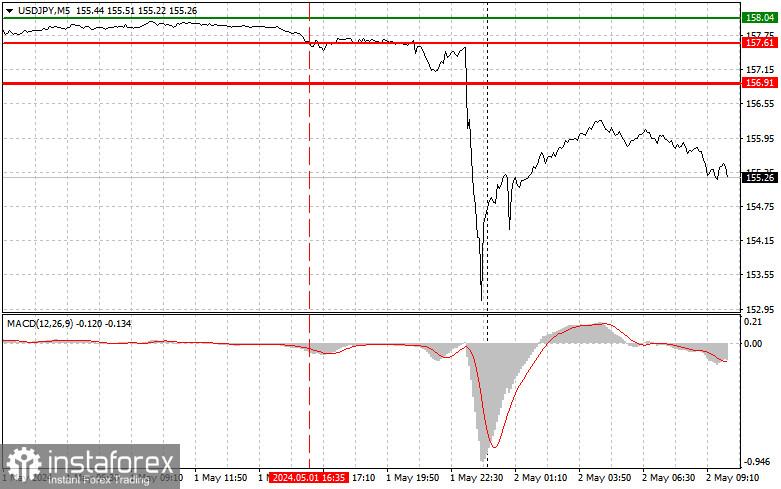 Overview of trading and tips on USD/JPY The price test of 157.61 at the beginning of the US session occurred at a time when the MACD indicator sharply fell from the zero mark, which limited the pair's downward potential. For this reason, I did not sell. The outcome of the Federal Reserve meeting, as you can see on the chart, was a big surprise for the dollar bulls, who were counting on a firm hawkish stance, which could have further weakened the Japanese yen due to the interest rate differential. However, it didn't happen, which resulted in heavy profit taking and a major USD/JPY sell-off. The bulls will probably continue to buy back yesterday's movement, but they will be cautious about it, as no one is safe from the next Bank of Japan currency intervention. As for the intraday strategy, I will rely more on the implementation of scenarios No. 1 and No. 2. 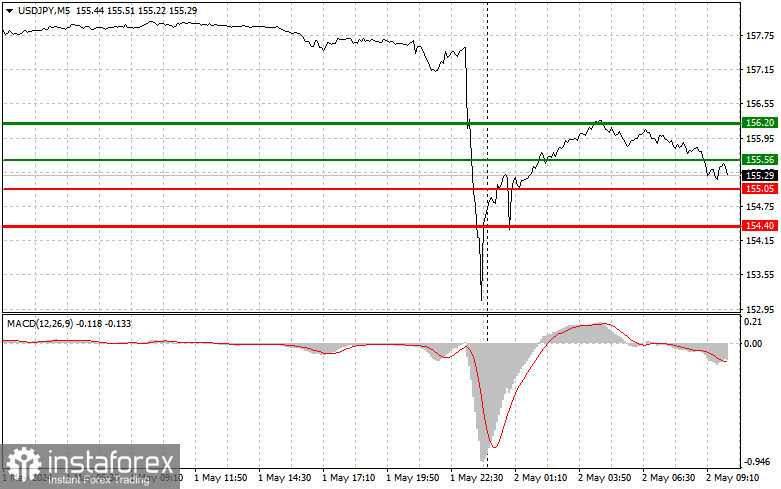 Buy signals Scenario No. 1. I plan to buy USD/JPY today when the price reaches the entry point around 155.56 plotted by the green line on the chart, aiming for growth to 156.20 plotted by the thicker green line on the chart. In the area of 156.20, I'm going to exit long positions and open short ones in the opposite direction, expecting a movement of 30-35 pips in the opposite direction from that level. You can count on USD/JPY's growth today in continuation of the upward trend. Before buying, make sure that the MACD indicator is above the zero mark and is just starting to rise from it. Scenario No. 2. I also plan to buy USD/JPY today in case of two consecutive tests of 155.05 at the time when the MACD indicator is in the oversold area. This will limit the downward potential of the pair and lead to an upward reversal of the market. We can expect growth to the opposite levels of 155.56 and 156.20. Sell signals Scenario No. 1. I plan to sell USD/JPY today only after testing the level of 155.05 plotted by the red line on the chart, which will lead to a rapid decline in the price. The key target for sellers will be 154.40, where I am going to exit short positions and also immediately open long ones in the opposite direction, expecting a movement of 20-25 pips in the opposite direction from that level. Pressure on USD/JPY may return in case of another central bank intervention. Before selling, make sure that the MACD indicator is below the zero mark and is just starting to decline from it. Scenario No. 2. I also plan to sell USD/JPY today in case of two consecutive tests of the price of 155.56 at the time when the MACD indicator is in the overbought area. This will limit the pair's upward potential and lead to a downwards market reversal. We can expect a decline to the opposite levels of 155.05 and 154.40. Analysis are provided by InstaForex. Read more: ifxpr.com/44oeuiV |
|
|
|
Post by instaforexbella on May 6, 2024 8:08:31 GMT -5
Forex Analysis & Reviews: Trading plan for GBP/USD on May 6. Simple tips for beginners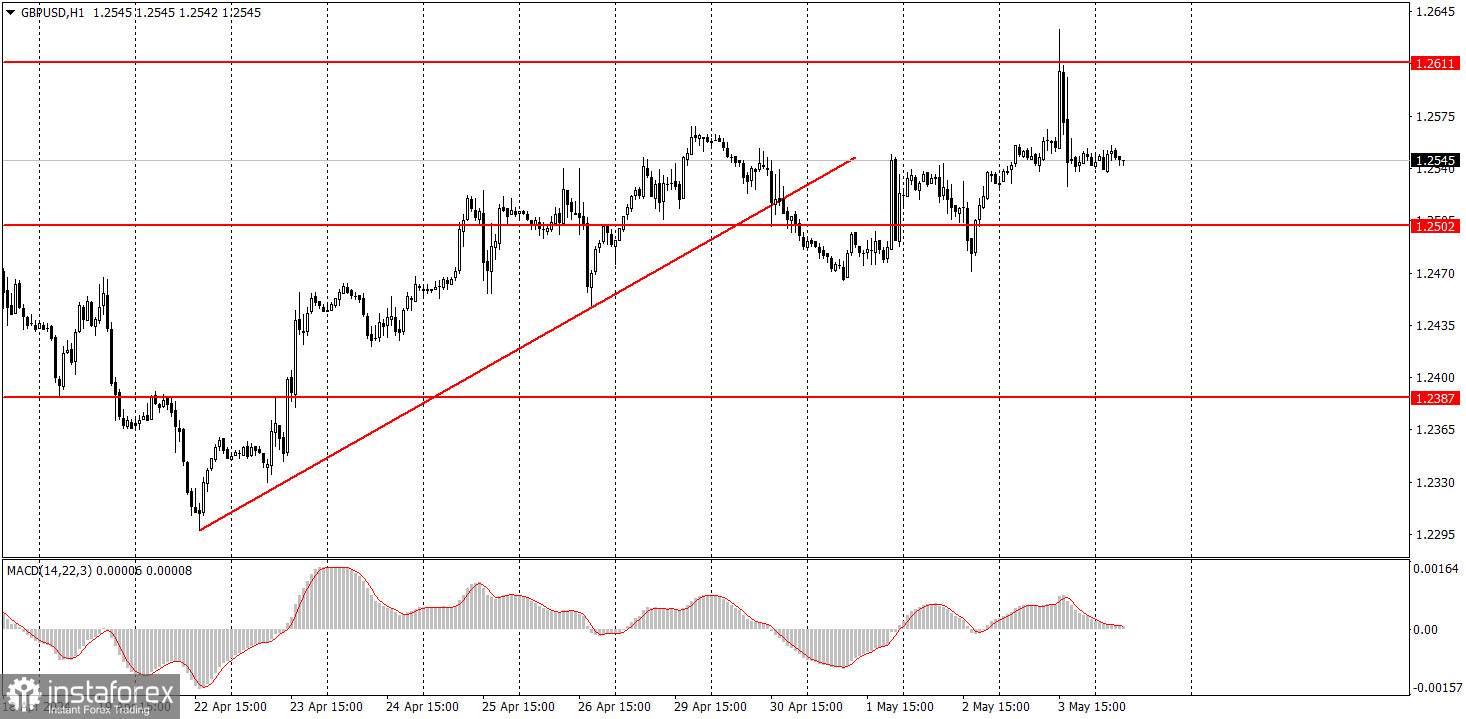 The GBP/USD pair continued its upward movement on Friday. As seen in the chart above, the price consolidated below the ascending trend line last week. At this point, the upward correction was supposed to end. However, a series of weak reports on the US labor market, unemployment, business activity, and job vacancies triggered a new and predictable decline in the US currency. We still believe that the fundamental background largely supports the dollar, while the pound's current rise is part of a corrective move. Therefore, we expect the global downward trend to resume. Over the past two weeks, economic data have disappointed the dollar, but this may not always be the case. The state of the British economy has been less than ideal for several years now. A bounce from the level of 1.2611 could mark the start of a new downward trend. 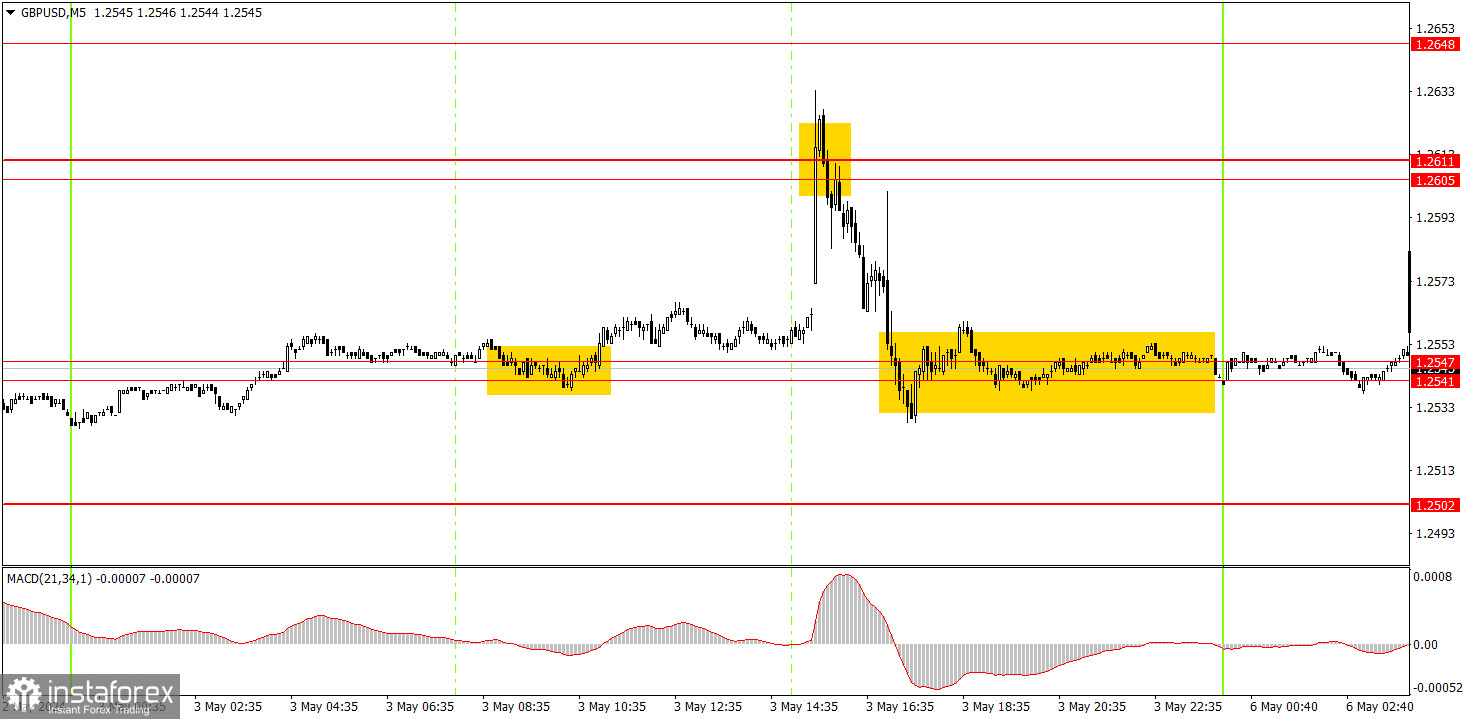 An excellent buy signal was formed during the European trading session, although the pair remained relatively unchanged throughout the session. However, significantly weaker-than-expected US macro data prompted a rise, which traders needed. In the afternoon, the range of 1.2605-1.2611 was tested, from which there was an imprecise rebound. This rebound could also have been interpreted as a signal, but this time it was for selling. However, it was difficult to say whether traders should have acted on it or not. It was also difficult to expect the dollar to rise with such weak US data. Nevertheless, those who opened short positions made profit, as the price returned to the range of 1.2541-1.2547 by the end of the day. Trading tips on Monday: On the hourly chart, the GBP/USD pair has excellent prospects for forming a downward trend, but is currently going through a correction. This corrective phase has been quite strong. The fundamental backdrop continues to support the dollar much more than the British pound. Therefore, we only expect downward movement from the pair. On Monday, the market is in a flat state, and there's a high chance that it will be another "boring Monday". Investors may trade from the range of 1.2541-1.2547, but as mentioned, there's also a very high chance of a flat market. The key levels on the 5M chart are 1.2270, 1.2310, 1.2372-1.2387, 1.2457, 1.2502, 1.2541-1.2547, 1.2605-1.2611, 1.2648, 1.2691, 1.2725, 1.2787-1.2791. Today, there are no scheduled events or reports in the UK and the US. Therefore, we don't expect strong movements today. Analysis are provided by InstaForex. Read more: ifxpr.com/4a8pN05
|
|
|
|
Post by instaforexbella on May 7, 2024 7:56:01 GMT -5
Forex Analysis & Reviews: EUR/USD. May 7th. The bulls are running out of strength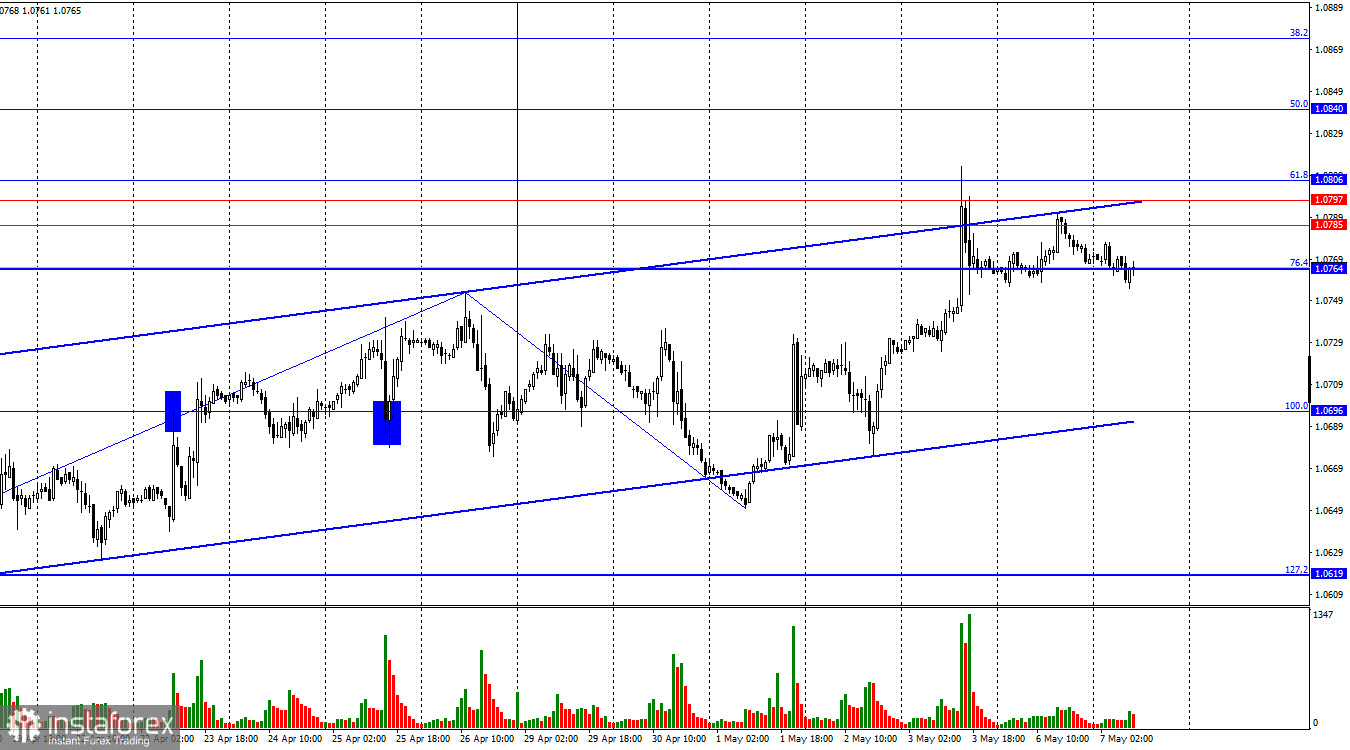 The EUR/USD pair on Monday retraced to the resistance zone of 1.0785–1.0797, which is part of the larger resistance zone of 1.0764–1.0806. A bounce of quotes from this zone will favor the American currency and lead to a new decline towards the corrective level of 100.0% (1.0696). The ascending trend channel continues to characterize traders' sentiment as "bullish." The consolidation of the pair's rate above the level of 1.0806 will increase the likelihood of further growth towards the next Fibonacci level of 50.0%–1.0840. 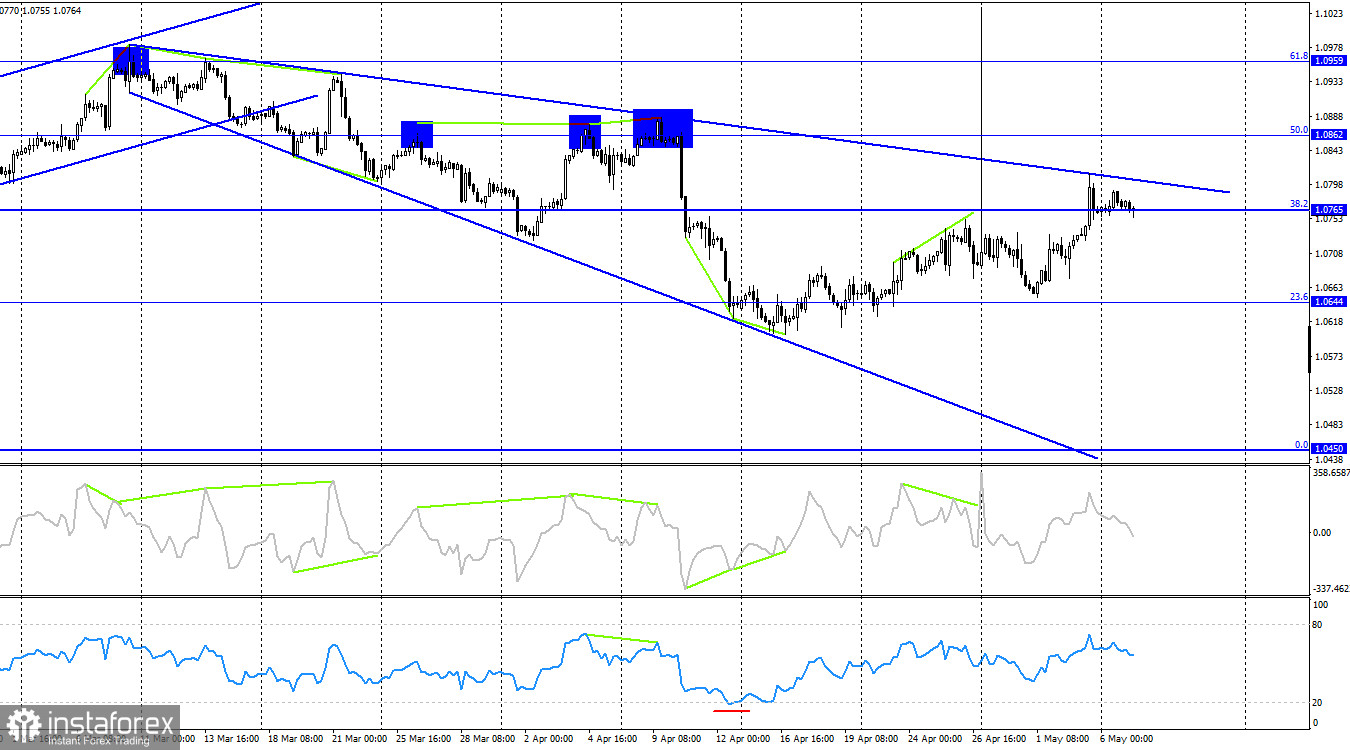 The wave situation remains unchanged. The last downward wave failed to reach the low of the previous wave, while the new upward wave had already broken the peak of the previous wave. Thus, a "bullish" trend has formed, but its prospects personally raise doubts for me. Over the past 2-3 weeks, the information background has supported bull traders, but will it continue to do so? This is a big question, as the economy of the European Union is not in the best shape, and the ECB is ready to start easing monetary policy much earlier than the Fed, already having a much lower interest rate. The information background on Monday was weak, and on Tuesday, it was even weaker. Neither yesterday nor today have we seen any attractive movements. Yesterday, it became known that the business activity index in the EU services sector was slightly above expectations – 53.3. Today, the retail trade report will be released. However, neither of these reports is paramount for traders, so it is quite difficult to expect further growth in the euro today. I believe that after the formation of another upward wave, a downward wave should begin, which allows for the current trend channel and the nature of movement. The bulls will find it difficult to break through the zone of 1.0764–1.0806 on the first attempt. I expect the euro to decline this week. Analysis are provided by InstaForex. Read more: ifxpr.com/3UMVZ4K
|
|
|
|
Post by instaforexbella on May 8, 2024 8:14:37 GMT -5
Forex Analysis & Reviews: GBP/USD. May 8th. The pound does not expect a rate cut by the Bank of England 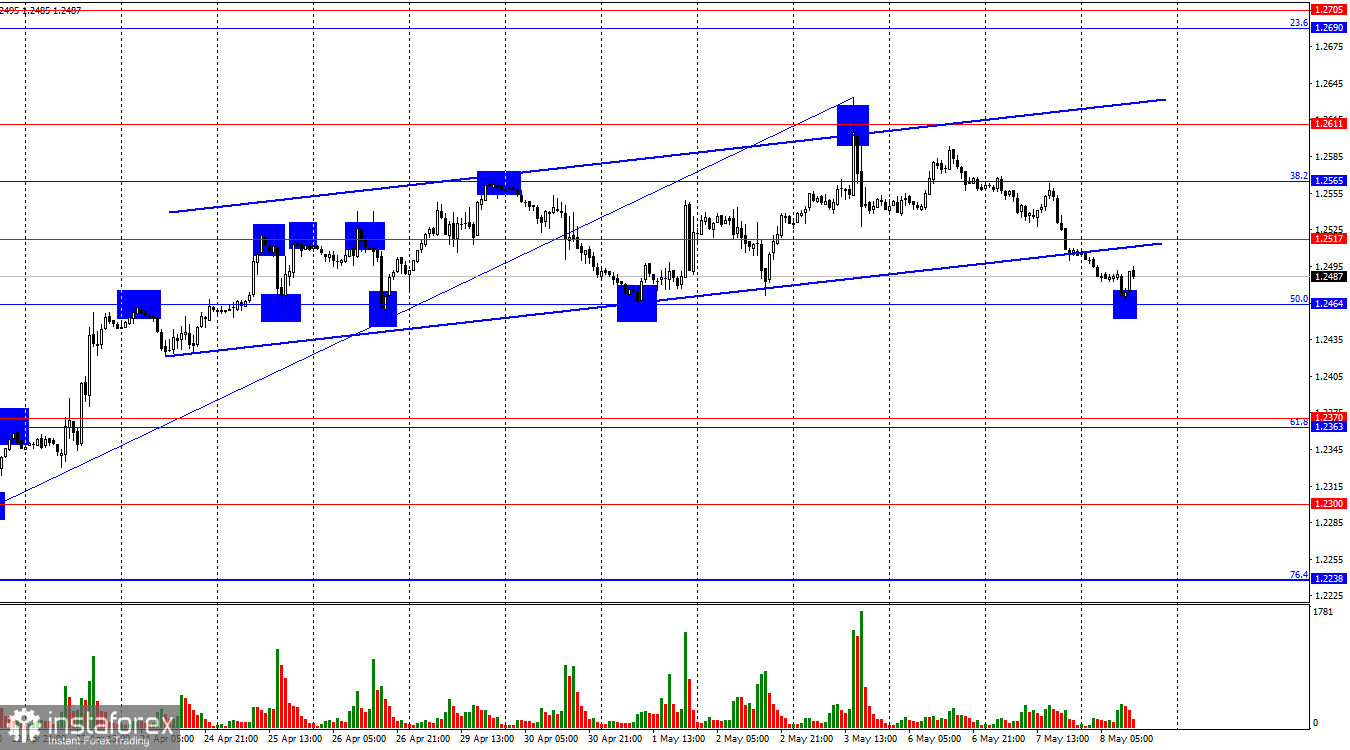 On the hourly chart, the GBP/USD pair continued its decline on Tuesday and confirmed consolidation below the ascending trend channel. Bulls lost their advantage on the hourly chart, and bears continue to maintain it on the 4-hour chart. Thus, the British pound has every reason to continue falling against the dollar. The rebound of quotes from the Fibonacci level of 50.0% (1.2464) allowed the pair to show a slight increase, but I expect consolidation below this level, which will allow counting on further decline towards the corrective level of 61.8% (1.2363). The wave situation remains unchanged. The last completed upward wave did not surpass the peak of the previous wave, and the new downward wave is still too weak to break the low of April 22. Thus, the trend for the GBP/USD pair remains "bearish," and there are currently no signs of its completion. The first sign of bulls turning aggressive could be the breakthrough of the peak on May 3. A new downward wave, if it turns out to be weak and does not break the low of April 22, could also indicate a trend reversal. Waves in recent months have been quite large, so it is necessary to reduce the scale of the hourly chart to understand the current trend clearly. On Monday, Tuesday, and Wednesday, there was no news from the UK or the US. However, this Thursday, the Bank of England meeting will conclude, and this event could leave a mark on the GBP/USD pair charts. Currently, traders do not believe that the rate will be cut. There are no grounds for this. Inflation in the UK continues to decline, but it is still too high for the regulator to take action. Most likely, the easing of monetary policy will begin in the autumn of 2024, but only if inflation continues to slow down. And we know that the opposite could also happen, as is currently the case in the US. On the 4-hour chart, the pair rose to the level of 1.2620 and bounced off it. The upper line of the descending trend channel has been broken, but it is still not time to bury the "bearish" trend. This week, a decline towards the levels of 1.2450 and 1.2289 has begun. Consolidation of the pair's rate below the level of 1.2450 will increase the probability of further decline towards the next correction level of 50.0% (1.2289). There are no imminent divergences today. Analysis are provided by InstaForex. Read more: ifxpr.com/3JQE9Hx |
|

